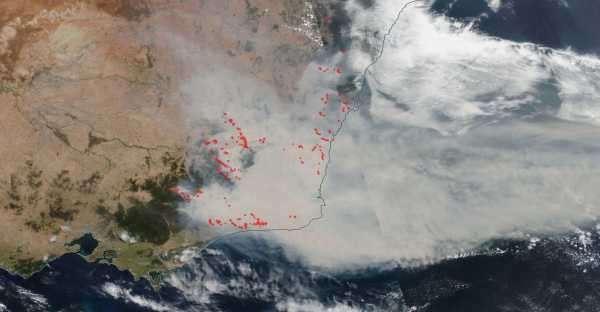

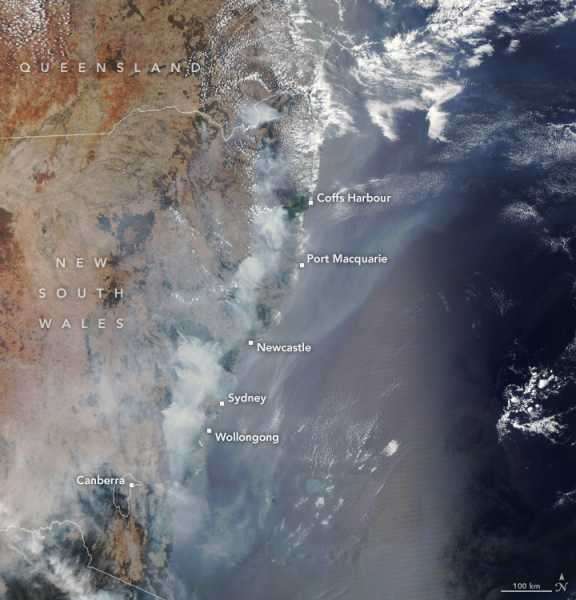
The Worldview tool from NASA’s Earth Observing System Data and Information System (EOSDIS) shows this scene on Jan. 2, 2020, as wildfires continue in their intensity along the southeastern coast of Australia.
Satellites in space can spot changes to Earth’s climate, and they are providing frightening bird’s-eye views of the devastating consequences of global warming.
The wildfires raging in the Australian states of New South Wales and Victoria began in November 2019, and they continue to pose severe safety and environmental problems. NBC News reported that thousands of Australians fled their homes on New Year’s Eve (Dec. 31), seeking refuge near the oceanside. On Thursday (Jan. 2) NBC News also reported that New South Wales declared a weeklong state of emergency, making this the third time an emergency period has been announced since the fires began.
on Dec. 31. Abbott, who is covering the wildfires for The New York Times, added: “Been covering the Australian bushfires for the last 6 weeks, but haven’t seen anything like yesterday’s fire that decimated the town of Conjola, NSW.”
My last day of the decade felt like the apocalypse. Been covering the Australian bushfires for the last 6 weeks, but haven’t seen anything like yesterdays fire that decimated the town of Conjola, NSW. #bushfirecrisis #AustralianBushfires #NSWisburning work for @nytimes pic.twitter.com/KmVKqDMKsfJanuary 1, 2020
Information from NASA satellites can teach scientists about the lingering consequences of these events, like the production of dangerous gases such as carbon monoxide.
NASA operates a group of 26 satellites collectively known as the Earth Observing System (EOS), and its flagship satellite, a bus-sized spacecraft named Terra, hit its 20-year mark in space in December 2019. Other NASA satellites, like Aqua and Suomi NPP, also contribute data to EOS, a mission tasked with taking global measurements of the air, land and water to help scientists learn how those systems fit together and morph over time.
The Worldview tool from NASA’s EOS Data and Information System transforms satellite data into an interactive page with over 900 imagery layers. You can view current natural disasters, like the Australian wildfires, on Worldview by date and information layer (such as thermal anomalies, borders and place labels). You can also watch an animation of activity by selecting a time range.
A look at Australia’s surface starting in October 2019 shows the astounding evolution of wildfires as they multiplied and spewed smoke across Australia’s eastern shore.
NASA’s Aqua satellite used its Moderate Resolution Imaging Spectroradiometer to capture this view of wildfires raging on Australia’s eastern coast on Dec. 9, 2019. The wildfires were fueled by unusually hot weather and a potent drought that primed the region in October 2019, according to the space agency.
A severe drought in October 2019 primed the country for the destruction that’s still occurring. More than 100 fires raged over the next several months. By Dec. 12, the wildfires in Australia’s New South Wales had scourged an area of about 10,000 square miles (27,000 square kilometers), according to NASA representatives in a description of satellite imagery.
The wildfires are raging on Australia’s eastern coast, exposing many communities, including Sydney, to hazardous pollution levels. The Measurements of Pollution in the Troposphere instrument on the Terra satellite found that the region is blanketed by abnormally high levels of carbon monoxide, an odorless and dangerous gas that’s released by the burning of plants and fossil fuels.
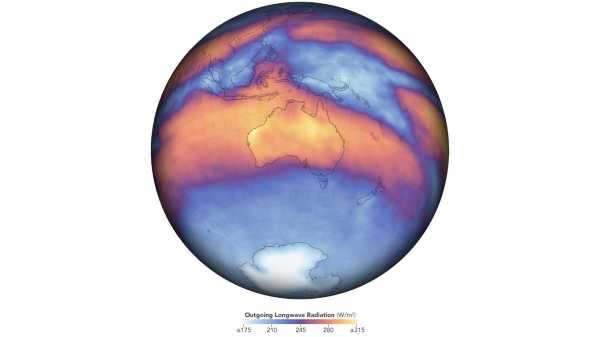
This map depicts measurements of outgoing longwave radiation in November 2019. The data on Australia’s heat emission comes from the Clouds and the Earth’s Radiant Energy System on board NASA’s Terra satellite.
The fires have been particularly damaging to eucalyptus forests. The forests exist in both dry and rainy regions, and both climates are vulnerable to the wildfires for unique reasons. Eucalyptus plants that thrive in dry areas have oil-rich leaves that can easily ignite during a fire, according to a NASA description of the EOS imagery. Fires do help these plants release their seeds, but the dry season in October was so intense that it limited seed germination. Rainforest eucalyptus species, on the other hand, are not accustomed to fires. The ecosystem can’t bounce back the way a dry eucalyptus forest could under milder conditions. Unable to tolerate the flames, most of these rainforest plants die under these extreme conditions.
An instrument on NASA’s Tropical Rainfall Measuring Mission satellite observed the unusually hot and dry conditions of November 2019 that fueled the wildfires. The sensor, called the Clouds and the Earth’s Radiant Energy System, measures the heat emitted back into space. The instrument measured how the sun’s radiation was absorbed, emitted and reflected by Earth’s surface during the first month of the wildfires.
The flames destroy forests and make the air unbreathable for humans, but they also harm the animals that live there. “Browsing animals like kangaroos are driven out by fire for a short time, and the heat treatment of soil reduces the number of plant-eating insects and soil organisms during the early growth period,” Ayesha Tulloch, a conservation biologist at the University of Sydney, said in a NASA image description.
This animation is a model of where the black smoke from the raging Australian wildfires is traveling. It’s based off of the GEOS forward processing (GEOS FP) model, which combines information from satellite, aircraft and ground-based observation systems and uses data such as air temperature, moisture levels and wind information to project the plume’s behavior.
Many koalas have also been affected, or even killed, by these fires. “But the range of the koala covers most [of] the east coast of Australia,” Tulloch said. “Relative to its range, the fires are relevant to only a very small proportion of the existing koala population in Australia.”
An animation made using the GEOS forward processing (GEOS -FP) model depicts the high levels of black carbon emitted by the wildfires in early November 2019, which then blew through the atmosphere and across the Pacific Ocean. Smoke plumes have risen as high as 7 to 8 miles (12 to 13 km) into the sky, which is unusually high for wildfires, according to a NASA description of the animation.
Sourse: www.livescience.com